2023-12-25
Heatmap
A heatmap is one of the oldest ways to visualize data. The data is arranged in a table, and its value determines the color of the cell: the greater the value, the brighter the color.
A similar map is used on GitHub to visualize user activity.
By the way, if the data is visualized on a map following the same principle, it is called a choropleth.
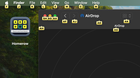
Out of interest, I made such a map on D3 for posts in this blog: