2022-06-21
Grafana
![]()
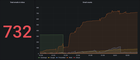
Grafana is an open-source app for visualizing and analyzing metrics. It supports many data sources, including Prometheus, InfluxDB, and more.
https://github.com/grafana/grafana

From its release in 2014, it evolved into a much more powerful tool. Now it can be used to:
- alert you when the metric is too high or too low via email, Slack, Telegram, PagerDuty, etc,
- browse logs from Loki, Elasticsearch, or CloudWatch,
- query distributed traces from Zipkin, Jaeger, or Tempo.